LUXURY PROPERTY SOLUTIONS · SOUTH FLORIDA
LPS For Boaters
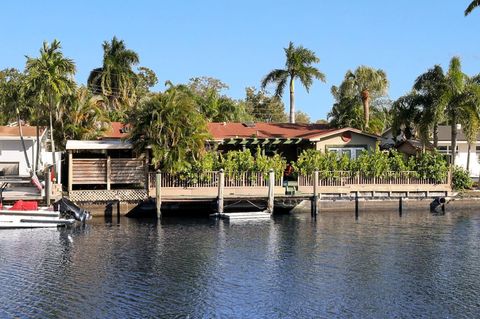
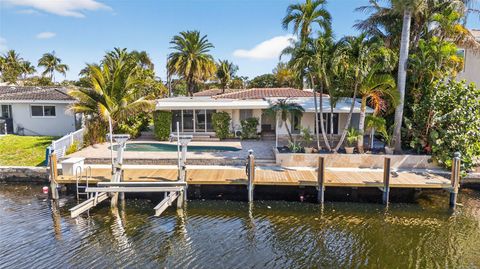
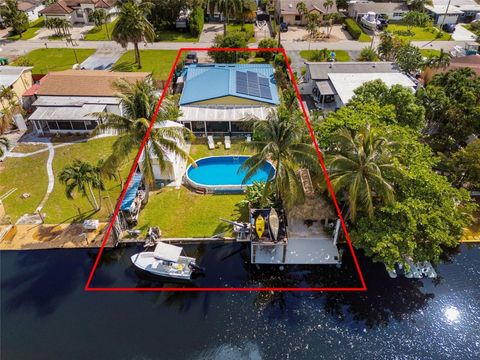
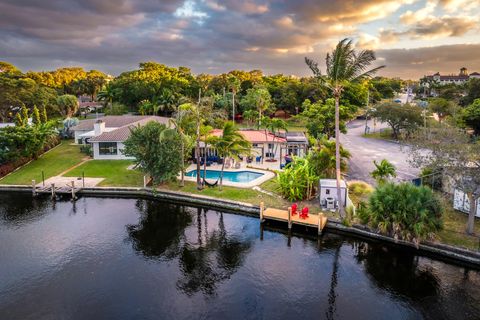
Waterfront homes for boaters & short-term rentals
We help boat owners and investors acquire ocean-access, no-fixed-bridge properties, convert them into high-performing short-term rentals, and unlock charter and guest amenity revenue — while handling permits, dock upgrades, and creative financing to reduce upfront costs.
- Targeted property sourcing for dock-ready waterfront homes
- Short-Term Rental preparations, staging, and furnishing coordination
- Dock vendor introductions, power hookup coordination, and marine upgrades
- Short-term rental licensing assistance and permit applications
- Creative financing structuring to use equity, seller concessions, and projected rental income
- Optional charter setup and water-sport amenity packages (jet skis, SUPs, kayaks)








Short-Term Rental Profitability vs Marina Docking
Illustrative comparison showing estimated short-term rental (STR) income for a waterfront property with boat access versus the annual cost of keeping the same boat in a marina slip. Assumptions: 60% occupancy (≈18 nights/month), nightly STR rates shown below, and 40% operating expenses (management, cleaning, platform fees, utilities, maintenance).
| Boat Size | Marina Slip (mo) | Marina Annual | STR Monthly Gross* | STR Annual Gross | STR Annual Net (after 40% OPEX) | Net Benefit Over Marina (STR Net − Marina Cost) |
|---|---|---|---|---|---|---|
| 20 ft | $300 | $3,600 | $2,700 | $32,400 | $19,440 | $15,840 |
| 30 ft | $450 | $5,400 | $3,600 | $43,200 | $25,920 | $20,520 |
| 40 ft | $700 | $8,400 | $5,400 | $64,800 | $38,880 | $30,480 |
| 50 ft | $1,000 | $12,000 | $7,200 | $86,400 | $51,840 | $39,840 |
| 60 ft | $1,500 | $18,000 | $9,900 | $118,800 | $71,280 | $53,280 |
*STR monthly gross = nightly rate × 18 nights/month (60% occupancy). Nightly rate examples used: 20ft $150 / 30ft $200 / 40ft $300 / 50ft $400 / 60ft $550. Net = gross × (1 − 40% OPEX). These are illustrative estimates to show the potential upside from operating the property as a short-term rental vs simply paying for a marina slip; actual results vary by market, listing quality, seasonality, and management choices.
Get an Analysis — Quick Intake
Complete the form below and we’ll send a tailored financing and cost plan including potential seller concession usage and out-of-pocket estimates.
Example cost scenarios (purchase price: $1,350,000 — 50 ft frontage)
| Item | Without 6% seller concession | With 6% seller concession |
|---|---|---|
| Purchase price | $1,350,000 | |
| Down payment (20%) | $270,000 | $270,000 |
| Typical closing costs (≈3%)* | $40,500 | Covered by seller concession (up to $81,000) |
| Brokerage One-Time Service Fee (LPS) | $10,000 | $10,000 |
| Furnishing & setup (example) | $50,000 | $50,000 (partially covered by concession) |
| Estimated renovation / pre-listing (LPS) | $35,000 | $35,000 |
| Seller concession available (6% of price) | — | $81,000 |
| Concession applied to closing + furniture | — | Closing $40,500 + $40,500 remaining toward furniture/repairs |
| Buyer out-of-pocket at closing (illustrative) | $370,500 (270,000 DP + 40,500 closing + 50,000 furn + 10,000 fee + 35,000 reno = 405,500 — here renovation assumed paid separately at start; in many cases renovation is paid from loan or bridge) |
$289,500 (270,000 DP + 9,500 balance on furniture + 10,000 fee + 0 closing covered — renovation separate) |
*Closing cost range varies (2%–5%). Renovation and furnishing numbers are examples — actuals depend on scope. Seller concessions are negotiated and may be applied in different ways depending on lender rules.