H4 · Direction
Map the major trend, recent swing highs/lows and nearby supply or demand. Decide whether the higher-timeframe structure supports a long, short or no trade.
Account & Lot Calculator — Pine and MT5
OWN IT or request unlocked source — one-time invoice
LPSLAMA / TRADER REALTOR PROGRAM
Four timeframes. One clear trade plan. Use the SLIM chart template, the Volatility Scanner and Master Agent to compare direction, define risk and manage an open position.
Educational workflow • MT5 desktop • Demo testing first • Prepared with Giovanni
01 / THE CHART SETUP
The installed template is named SLIM.tpl—the “Slip” setup referenced for this guide. The download includes four derived templates for the requested layout. Open four charts of the same instrument and verify the timeframe after applying each.
Map the major trend, recent swing highs/lows and nearby supply or demand. Decide whether the higher-timeframe structure supports a long, short or no trade.
Look for a pullback or a confirmed break and retest within the H4 direction. Mark the level that would invalidate the idea.
Display MIMI FX SLIM here only. Require its bias and confidence to agree with the plan. Check the pullback, indicator alignment and target room.
Use a completed candle to confirm entry timing after the M5 setup. A momentary tick or changing current-bar signal is not a completed trigger.
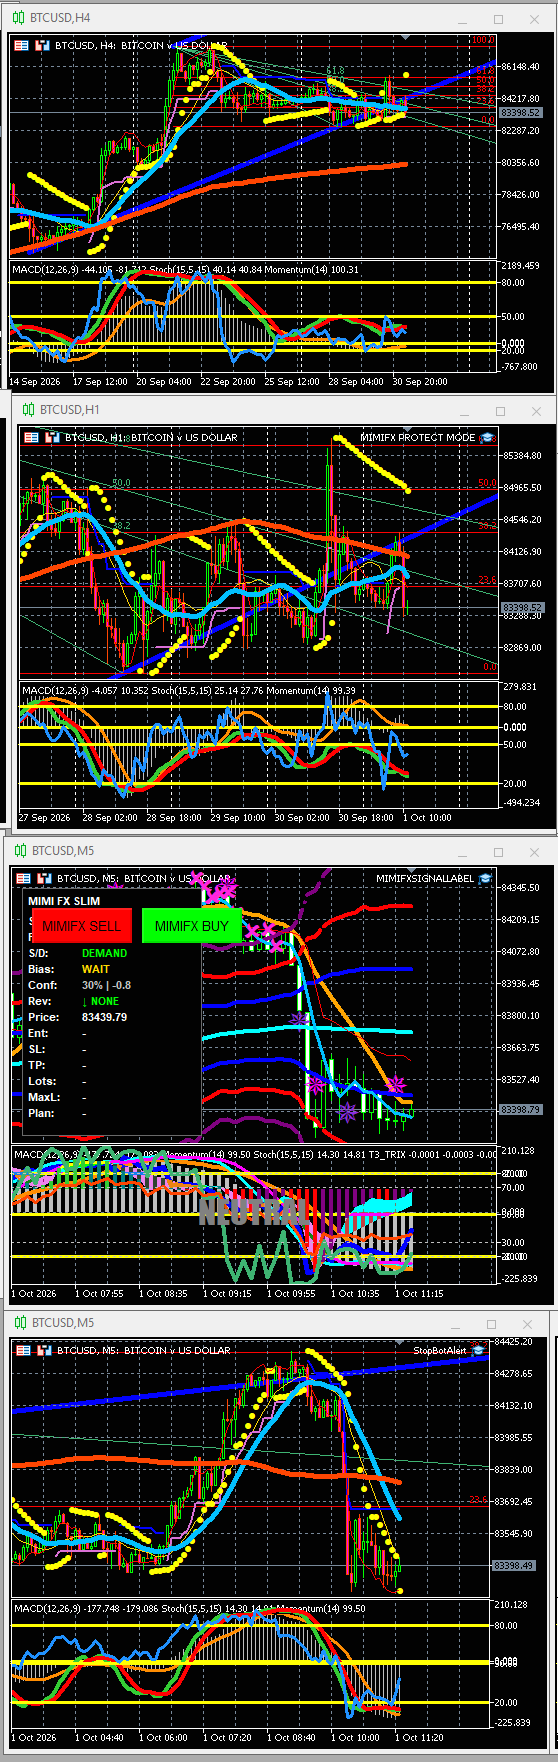
MT5 allows one Expert Advisor per chart. Indicators can share a chart. Put the Signal Label EA on M5 with the SLIM indicator, Protect Mode on a separate H1 chart, and StopBotAlert on M1. Keep the Scanner and Master Agent on additional dedicated charts. Run only one account-wide Protect Mode instance.
02 / ENTRY RULES
Use this as a demo-testable discretionary strategy. The tools overlap because many read the same price data; five agreeing indicators do not equal five independent pieces of evidence. Confidence is a score, not a measured probability of profit.
| Check | Buy setup | Sell setup |
|---|---|---|
| H4 + H1 structure | Both support higher highs/lows or an established upward trend. | Both support lower highs/lows or an established downward trend. |
| M5 location | Pullback holds support/demand; price reclaims the short averages. | Pullback stalls at resistance/supply; price loses the short averages. |
| Directional confirmation | MACD rising, Stochastic main above signal, Momentum rising; M1 close agrees. | MACD falling, Stochastic main below signal, Momentum falling; M1 close agrees. |
| MIMI FX SLIM | BUY bias; confidence at least the tested threshold (demo example 70%); no reversal pause. | SELL bias; confidence at least the tested threshold (demo example 70%); no reversal pause. |
| Scanner + Master | Fresh eligible BUY from Scanner; Master flow/setup supports BUY, not WAIT or a conflicting reversal. | Fresh eligible SELL from Scanner; Master flow/setup supports SELL, not WAIT or a conflicting reversal. |
| Costs + target | Target before opposing resistance, with estimated net reward at least net risk. | Target before opposing support, with estimated net reward at least net risk. |
| Decision | Enter only after every required check passes and risk is sized. | Enter only after every required check passes and risk is sized. |
Stand aside: mixed H4/H1 direction, SLIM WAIT, stale quotes, WIDE SPREAD, insufficient room, or unresolved high-impact news. Do not force a trade because a row has high confidence. In the reference Scanner image, some 100% rows are still blocked by spread.
The Scanner’s “Pip Range” is movement already observed. “Room now” measures distance to a recent range boundary; neither predicts movement still to come. This page’s checklist does not automatically enforce entries in the manual Signal Label EA.
03 / INSIDE THE TEMPLATE
Settings below were read from SLIM.tpl and the installed source files. Expand an item for its role and limitations. Download all SLIM custom indicators
MIMIFX_Currency_StrengthV6.ex5
Scores price versus EMA20, EMA20 versus EMA50, RSI14 and Momentum14 across four configured timeframes. Combines these with supply/demand context and a reversal penalty to display BUY, SELL or WAIT, confidence and a trade plan. Despite its filename, inspect the displayed symbol’s score; do not assume it is an independent currency basket model.
Template settings: EMA 20/50; RSI 14 with 55/45 levels; Momentum 14; ATR 14; zone lookback 50; ATR buffer 0.30. Panel on M5 only.
The original template has 55% minimum confidence and a 10% displayed risk budget. The provided learning preset uses 70% and 0.5%; its lot display is not broker-validated sizing.
Built-in MA + Examples/AMA.ex5
SMA5 and SMA13 show short-term direction; AMA adapts its smoothing to price movement. Compare slope and price position, then check higher-timeframe structure.
Template settings: SMA 5 and 13, close price in the saved template. AMA 10 / fast 2 / slow 30, open-price input in the saved template.
Averages lag. A cross alone is not an entry, and sideways markets can produce repeated reversals.
Downloads/afl_winnersign.ex5
Uses volume-weighted price, range normalization and two smoothing stages. Marks a change when the first smoothed series moves above or below the second. It is an event marker, not a continuous trade instruction.
Template settings: iAverage 5; iPeriod 10; iLength 5; iMA_Method 0; iPhase 15; IPC 7; tick volume; Shift 0.
The current-bar marker can change. Verify at the candle close. Author’s Code Base page.
Downloads/atr_channels.ex5
Draws a smoothed center line and bands spaced by Average True Range. Use them to see expansion, extension and the room around price. Bands are not guaranteed reversal levels.
Template settings: ATR 18; center smoothing length 100; multipliers 1.6 / 3.2 / 4.8; method 0; phase 15; IPC 1; no shift.
ATR measures movement, not buy/sell direction. Author’s download and documentation.
Downloads/MIMIFX MOUTEKI.ex5
Builds TD-style swing levels and projected lines from detected highs and lows. Use the lines as candidate structure to check against actual price action.
Template settings: ProjectionLines=true; HorizontLine=true; TrendLine=false; AlertsOn=false; Comments=false in SLIM.tpl.
Swing confirmation can be delayed and projections can change as new pivots form. A drawn target does not guarantee a fill.
Examples/MACD.ex5
Compares fast and slow EMAs and a signal average. Rising/falling MACD helps describe momentum; its position relative to zero adds trend context.
Template settings: 12 / 26 / 9; close price.
Signal Label uses the slope of MACD, not the same condition as STOMACD2. A rising MACD below zero can still be a bearish-trend pullback.
Built into MT5
Shows the close’s position within its recent high-low range. Main versus signal gives directional context; 20/80 mark extremes and 50 is the midpoint.
Template settings: 15 / 5 / 15; SMA; Low/High; levels 20 / 50 / 80.
Overbought can persist in an uptrend and oversold in a downtrend. Do not automatically fade a trend at these levels.
Examples/Momentum.ex5
Compares price with its value 14 bars earlier. Above/below 100 adds directional context; rising/falling momentum shows acceleration changes.
Template settings: Period 14; close price. Signal Label and STOMACD2 also calculate their internal Momentum on close.
Compare the same symbol, timeframe and candle when checking the plotted line against an EA’s reading.
STOMACD2.ex5
BUY marker requires Stochastic main above signal but below 50, MACD above signal but below zero, and rising Momentum. SELL mirrors this above the midpoints with falling Momentum.
Template settings: Internal Stochastic 15/5/15, MACD 12/26/9, Momentum 14. Email/push disabled in the supplied templates.
This is a pullback/reversal-style event marker. It need not print on every trend continuation. Current-bar arrows can disappear; do not require a fresh arrow from every event indicator on every candle.
Downloads/t3_trix.ex5
Smooths the price-change signal with Tillson-style averaging and plots a signal relationship and colored histogram. Compare direction, signal relationship and divergence with the trend.
Template settings: XMA_Method 7; lengths 10 / 18; phase 70; IPC 1.
A supplementary momentum check, not an independent forecast. Author’s download and dependency.
Built into MT5
Williams %R locates price within a recent range; RSI compares recent gains and losses. They add momentum and extension context to the chart.
Template settings: Both period 14; RSI uses close price in the template. SLIM’s internal RSI uses close price and 55/45 thresholds.
Avoid counting several oscillators as independent confirmations. Divergence is a warning to investigate, not a guaranteed reversal.
MIMIFXSIGNALLABEL displays BUY when MACD rises, Stochastic main is above its signal and Momentum rises; SELL uses the opposite conditions. Mixed conditions show NEUTRAL. It evaluates the current bar and its buttons can send market orders—even against the signal after a confirmation. Its source does not attach an initial SL or TP. Set volume deliberately and plan a protective stop before use. It is separate from the SLIM confidence panel.
Download Signal Label EA04 / INSTRUMENT PLAYBOOK
Demo examples, not optimized presets. All instruments use H4/H1/M5/M1, the same indicator periods and the 70% example confidence floor. The values below are StopBotAlert start / distance / step, in that EA’s FX pips. No performance claim is attached to them. Choose initial stops from invalidation and size the trade accordingly.
One FX pip: 0.0001. Trail start / distance / step: 12 / 10 / 3.
Monitor ECB/Fed releases and both regions’ inflation/employment. Use a pullback holding H1 support/resistance; avoid an M1 trigger directly into the next H4 level.
Correlation check: Compare GBPUSD for shared USD pressure; check EURGBP to separate euro strength from sterling strength.
One FX pip: 0.0001. Trail start / distance / step: 18 / 15 / 5.
Check BoE and UK releases as well as US news. Demo-test a wider trail than EURUSD; if the structural stop is larger, reduce position size rather than forcing a tight stop.
Correlation check: Compare EURUSD and EURGBP; agreement may reflect the same USD exposure.
One FX pip: 0.01. Trail start / distance / step: 15 / 5 / 15.
Check BoJ/Fed events. The example sell at 158.15 activates at Ask 158.00 and first places SL around 158.05 with the 5-pip distance. It next improves after another 15 pips if price and broker rules permit.
Correlation check: Compare other JPY crosses and US/Japan yields as context; the relationship can change.
One FX pip: 0.0001. Trail start / distance / step: 12 / 10 / 3.
Check RBA and Australian releases, then US events. Use H4/H1 agreement and a completed M1 trigger; reject trades when spread consumes too much of the intended target.
Correlation check: Compare NZDUSD and AUDNZD; inspect China-related headlines without assuming a fixed reaction.
One FX pip: 0.0001. Trail start / distance / step: 12 / 10 / 3.
Check RBNZ and New Zealand releases. Confirm fresh quotes in the chosen session; do not carry settings across a broker’s rollover spread expansion.
Correlation check: Compare AUDUSD and AUDNZD; account for the combined USD direction.
One FX pip: 0.0001. Trail start / distance / step: 15 / 12 / 4.
Check BoC, Canadian data and US releases. If buying USDCAD for USD strength, compare with EURUSD weakness rather than demanding both charts show BUY.
Correlation check: Observe CAD crosses and oil as context; oil and CAD do not have a permanent one-to-one relationship.
One FX pip: 0.0001. Trail start / distance / step: 12 / 10 / 3.
Check SNB and Fed events. Confirm actual spread and executable stop distance before using a small M1-based target.
Correlation check: Compare EURCHF and USD peers; safe-haven flows can disrupt ordinary correlations.
One FX pip: 0.01. Trail start / distance / step: 25 / 20 / 5.
Separate yen weakness from base-currency weakness. These crosses share JPY exposure; choose the clearest setup rather than treating three similar trades as diversified.
Correlation check: Compare USDJPY plus the corresponding EURUSD, GBPUSD or AUDUSD leg.
One FX pip: Broker-specific. Trail start / distance / step: ATR-based; convert first.
Crypto CFDs have broker-specific contract sizes, costs and sessions. Use M5 ATR14 as a demo distance reference; convert the price distance into the EA’s unit before entering any number.
Correlation check: Compare each other and broader risk markets only when the current relationship is visible.
One FX pip: Broker-specific. Trail start / distance / step: ATR-based; convert first.
Check US market hours, major earnings and US releases. Confirm contract size and tick value; never copy FX pip numbers directly into index CFDs.
Correlation check: Compare index structure and breadth; three US index positions can be one concentrated risk.
For non-FX symbols, StopBotAlert defines one unit as 10 × broker Point for 3- or 5-digit quotes, otherwise 1 × Point. That convention may not match the Scanner’s “points.” For an illustrative ATR rule, test start = 1.5 × M5 ATR14, distance = 1 × ATR14 and step = 0.25 × ATR14, each converted into the EA’s units. These multiples are research starting points, not a claim that ATR determines a safe stop.
05 / MANAGING AN OPEN TRADE
Set three different values: start is profit before activation; distance is how far the stop sits behind executable price; step is the minimum improvement before the next update.
USDJPY sell 158.15: start 15, distance 5, step 15. At Ask 158.00, SL is about 158.05; at 157.85, SL is about 157.90; at 157.70, SL is about 157.75. Existing stops and broker stop/freeze distances can change this sequence.
Use Manage only the chart symbol=true for symbol-specific settings. Keep AllowStopLossLoosening=false. Initial stop loss=0 disables this EA’s initial-stop placement; it does not create protection before trailing starts. MT5 and the EA must remain running for updates; an accepted server-side stop remains with the broker.
Profit alerts notify you; they do not close a trade. The money alert totals managed floating profit plus swap, and does not explicitly subtract commission in this build. Default money alert: 100 in account currency.
Download StopBotAlertThe installed build attempts to close 0.01 lot per operation when margin level reaches its configured trigger. It picks the oldest eligible position; MagicNumber=0 means the whole account, not just the chart symbol. It may attempt up to six reductions in one tick and can close the remaining position entirely.
Its original trigger is 55%, then it tries to recover above trigger + 5 percentage points. This is source behavior, not a recommended margin threshold. Compare your broker’s margin-call and stop-out rules before setting a trigger; 55% can already be too late. Use one instance and test volume minimum/step, partial fills and margin effects on demo. This build does not validate all broker volume constraints.
Reducing a losing position realizes part of its loss. It may preserve a smaller position during a spike, but price may never recover, execution may fail, and margin relief is not guaranteed on hedged positions. Stop adding exposure, retain a planned hard exit, and do not use this tool as a reason to hold an invalidated trade.
Download original Protect Mode buildBoth trade managers can affect live accounts when enabled. The supplied templates do not attach them automatically. The guide does not claim these tools prevent liquidation or make an overloaded position safe.
THE TWO DECISION SCREENS
Rank instruments by observed range, inspect H4/H1/M15/M5 scores, then check Recommendation, Scan Status, Spread, quote time and Room now. The packaged 1.03 build supports continuous scanning. A fresh BUY or SELL with an eligible status is a candidate for chart review, not an instruction to enter.
FX rows use pips; non-FX rows use broker points. A timestamped bid/ask is a snapshot. Continuous scanning still takes time and does not make every row a live tick feed.
Download Scanner 1.03Use the dashboard to inspect directional flow, confidence, supply/demand, reversal warnings and proposed entry/stop/target. The verified file is AMIMIFX_Master_v16.19_AGENT.
This Agent edition is the analysis-only bridge, not the trading-enabled FINAL EA. The live-setup pane indicator is included. Keep MaxRows at 30 (maximum 32) and use page arrows. For multiple symbols, select Market Watch as the dashboard source; TYPE: ALL alone does not override a chart-family source.
Download Master Agent + pane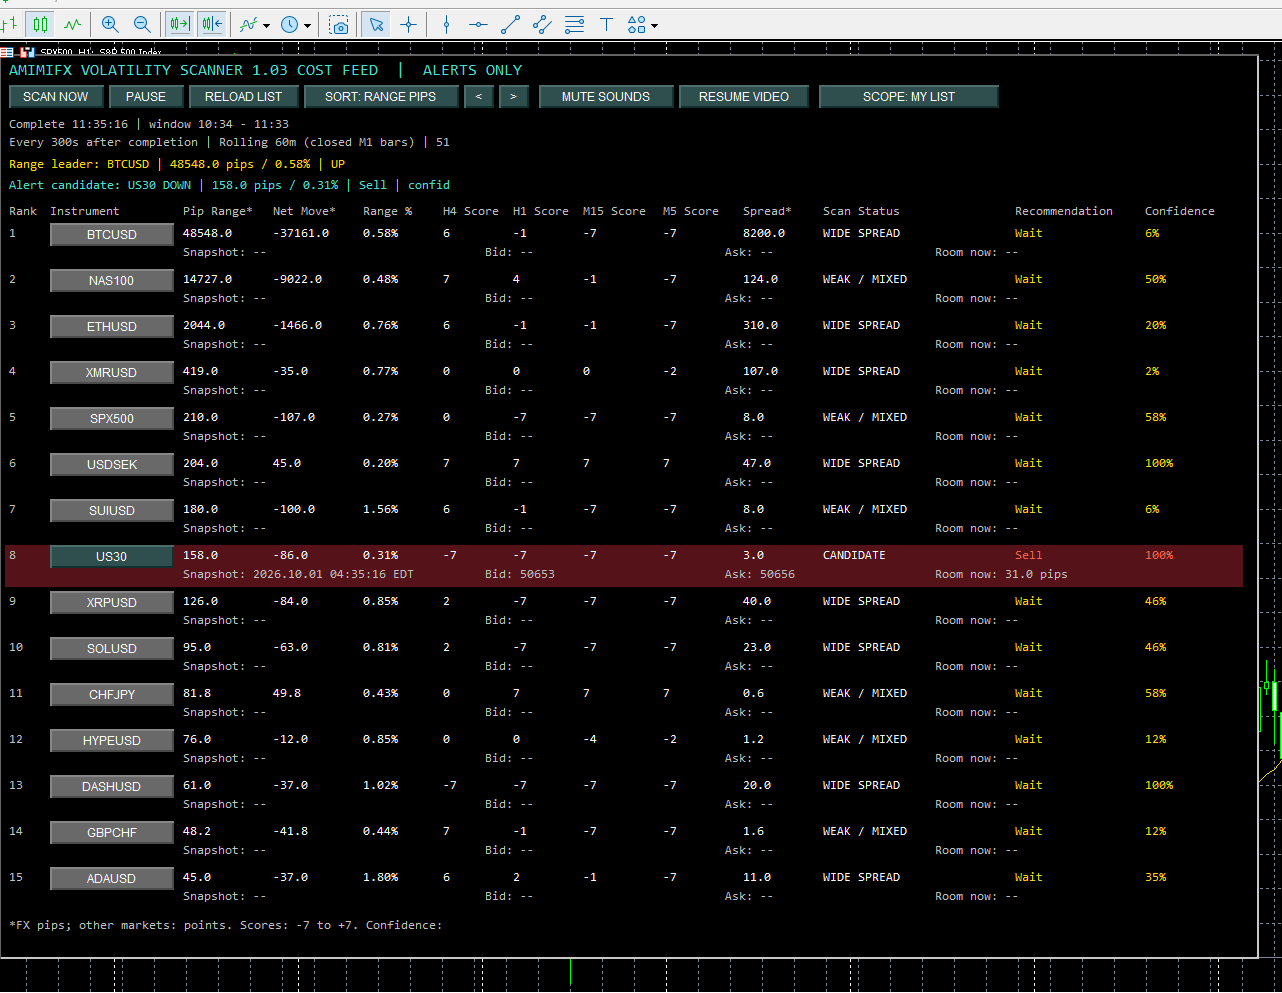
06 / THE WORKSPACE
Giovanni’s preferred layout uses six 4K monitors to keep several instruments and their correlations visible. Four monitors can combine the same jobs. More screens improve visibility—not the probability of a winning trade. Confirm graphics-card outputs, scaling, readability and MT5 performance before choosing hardware.
H4, H1, M5 and M1. SLIM panel on M5 only. Annotate the trade before entry.
The same four-timeframe layout for comparison pairs; focus on shared currency exposure.
Rank fresh candidates, spread, range and room. Keep quote timestamps visible.
Flow, confidence, trade plan and reversal context. Monitor account exposure separately.
News feed and Trading Economics: US 10Y plus relevant country yields and yield differences.
FXStreet alongside Myfxbook. Match timezone, event, period and revision before comparing numbers.
Four-monitor alternative: screen 1 primary instrument; screen 2 correlated instruments; screen 3 Scanner and Master side by side; screen 4 news, yields and both calendars in tiled windows.
Two calendars can help catch omissions, different classifications or delayed updates; they may still share sources. If figures disagree, check the issuing agency. Match your local timezone and daylight-saving settings with broker server time. Yield direction adds macro context and can diverge from currencies during changing market conditions.
07 / DOWNLOADS & INSTALLATION
These are copies of the installed MT5 binaries and newly derived chart presets. They have not been recompiled or certified for every broker. Test the assembled setup on demo; do not install MT5 files into MT4. Copyright remains with the original authors.
All packages below, installation notes and file manifest.
Download ZIPH4, H1, M5 and M1; SLIM panel on M5; saved chart objects and the order-entry EA removed.
Download ZIPAll nine custom indicator files referenced by the recovered template, including the MT5 Examples files.
Download ZIPBUY/SELL/NEUTRAL label and manual order buttons. Attach deliberately.
Download ZIPTrailing stop manager with floating profit/loss alerts.
Download ZIPPartial-close margin manager; read its limitations before enabling.
Download ZIPContinuous-scanning cost-feed Agent edition.
Download ZIPAnalysis-only dashboard and its required live-setup pane indicator.
Download ZIPIncluded vs built-in: native Moving Average, Stochastic, Williams %R and RSI need no separate download. If compiling third-party source instead of using these binaries, ATR Channels, AFL WinnerSign and T3 TRIX reference SmoothAlgorithms.mqh under MQL5/Include; use their author pages for source/dependency downloads.
LPSLAMA TRADER REALTOR PROGRAM
For help with the template, indicators or chart layout, contact Giovanni directly.
Educational material, not personalized investment advice. Leveraged trading can produce substantial losses. No profit, recovery, confidence calibration or backtested performance is promised. Decide whether the risks fit your circumstances and verify all settings on demo.
Return to LPSLAMARequest a one-time invoice for your chosen strategy. OWN IT = 10 times its listed monthly amount. Unlocked Source Code = 20 times the monthly amount in total. The source option includes the personal-use licence; it is not another 20 payments on top of OWN IT.
One-time personal-use licence for the agreed current version, with protected code. No recurring strategy licence fee under the agreed licence.
Request OWN IT invoiceEditable source for the agreed current version and a personal-use licence, where LPS has the right to deliver it. No recurring strategy licence fee under the agreed licence.
Request source-code invoiceThese are invoice requests, not active checkout offers. Listed monthly figures are planning bases until the product and delivery route are approved. OWN IT means a software use licence, not ownership of LPS intellectual property or exclusive rights. Unlocked source does not grant resale, redistribution, sublicensing or copyright transfer. Account/device limits, delivery, future updates, support, taxes and refund terms must be stated in the invoice/licence. Existing subscription payments are not automatically credited. No profit is promised.
Pine delivery review: TradingView Marketplace manages paid invite-only access. An LPS invoice does not bypass those rules or grant permanent TradingView access. One-time/source delivery is quoted only after confirming platform rules and source rights. MT5 one-time licensing also requires a compatible perpetual licence implementation before delivery.
| Platform / strategy | Monthly pricing base USD | OWN IT · 10× · USD | Unlocked code · 20× total · USD |
|---|---|---|---|
| Pine — NQ 30m Gamma Flip (nq-core) | $5,000.00 | $50,000.00 | $100,000.00 |
| Pine — NQ 30m Gamma Flip (nq-one) | $2,500.00 | $25,000.00 | $50,000.00 |
| Pine — NQ 15m Gamma Flip (nq15) | $2,250.00 | $22,500.00 | $45,000.00 |
| Pine — NQ 5m Gamma Flip (nq5) | $1,750.00 | $17,500.00 | $35,000.00 |
| Pine — MNQ 5m Slow SAR (mnq-sar) | $1,500.00 | $15,000.00 | $30,000.00 |
| Pine — US30 5m Slow SAR + MACD (us30-sar) | $500.00 | $5,000.00 | $10,000.00 |
| Pine — SUI 4h Slow SAR (sui-sar) | $350.00 | $3,500.00 | $7,000.00 |
| Pine — SUI 4h SAR + STC (sui-stc) | $300.00 | $3,000.00 | $6,000.00 |
| Pine — SUI 4h SAR + MACD (sui-macd) | $275.00 | $2,750.00 | $5,500.00 |
| Pine — SUI 4h SAR + STC + MACD (sui-both) | $325.00 | $3,250.00 | $6,500.00 |
| Pine — MNQ 30m CVD ADX20 (mnq-cvd) | $250.00 | $2,500.00 | $5,000.00 |
| MT5 — Nasdaq Gamma/Core | $5,000.00 | $50,000.00 | $100,000.00 |
| MT5 — Nasdaq Slow SAR | $1,500.00 | $15,000.00 | $30,000.00 |
| MT5 — US30 SAR + MACD | $500.00 | $5,000.00 | $10,000.00 |
| MT5 — SUI SAR | $350.00 | $3,500.00 | $7,000.00 |
| MT5 — SUI SAR + STC | $300.00 | $3,000.00 | $6,000.00 |
| MT5 — SUI SAR + MACD | $275.00 | $2,750.00 | $5,500.00 |
| MT5 — SUI SAR + STC + MACD | $325.00 | $3,250.00 | $6,500.00 |
| MT5 — Nasdaq CVD Pressure + ADX | $250.00 | $2,500.00 | $5,000.00 |
Questions: team@lpslama.com. Source delivery is subject to ownership/licence review. Market/data/platform services and brokerage fees remain separate. Research and live trading risks remain unchanged.
Historical scaling illustration — not an earnings forecast or a new backtest. USD account and USD contract values only. One alternative per exposure family across both platforms. Blue = Nasdaq; purple = US30; teal = SUI. Colors identify exposure, not safety.
Recorded net already includes the costs used in its test. Inputs above add cost stress; do not enter the same included fees twice. SUI Pine financing was excluded. Broker levels must use Equity ÷ Used Margin × 100; cash-based stop-out accounts are unsupported. Futures use verified broker margin per contract, not notional ÷ leverage. Missing specifications leave limits unavailable. Only the tested configurations listed below have return data; other bots on a hosting page are not assigned these results.
| Select / strategy | Size & broker specifications | Test net / return | 30-day / weekly / daily USD & % | Historical DD / stress | Margin / limits | Status |
|---|---|---|---|---|---|---|
| No selection | ||||||
Each maximum assumes this row alone, after existing margin. Selected rows share one equity balance. Sum of scaled drawdowns is a stress comparison, not measured combined drawdown. Different test dates, correlations, variable position sizes, fills, gaps, tiered margin and broker limits prevent linear scaling from proving executable returns. No compounding. Re-run Strategy Tester and forward-test any size change. Pine native trailing results are particularly fill-sensitive ($164,310 versus $56,910 completed-close comparator); US30 failed doubled-cost stress. NAS100 SAR August lost $3,784.55 at .01 lot, DD $4,791.05; that larger DD is used for its stress limit.